Dynamic light scattering

Dynamic light scattering (DLS) is a non-destructive method used to characterize particle or colloid size distributions in a solution. The typical measurement range is from around 0.3 nm to 10 µm.

Green laser DLS
...and more than 700 other happy clients

Some of our most popular particle size distribution analyses

Particle size distribution with TEM

Particle size distribution (PSD) is determined from transmission electron microscopy (TEM) images. The method is most suitable for small particles of 50 nm or smaller. Depending on particle shapes, the method includes calculating the diameters or lengths and widths of particles. In addition to size, TEM provides qualitative information about the surface morphology of the particles. TEM is a good option for irregularly shaped and non-spherical particles such as fibers, rods, and crystals that cannot be characterized meaningfully with traditional methods, including laser diffraction (LD) and dynamic light scattering (DLS). As a result of the analysis, TEM images and the determined particle size distribution for diameter (or length and width) are delivered. Dry samples are suitable for TEM as is. If the particles are wet or dispersed in a solvent, the sample may be dried with a suitable sample preparation method before imaging.
1,551–2,111 €
Read more

Particle size distribution using dynamic light scattering (DLS)

Determination of particle size distribution (PSD) by dynamic light scattering (DLS). Analysis can be done from dispersions or solids that can be dispersed in water or organic solvents. The method is suitable for particle sizes from 0.4 nm to 10 µm.
87–371 €
Read more

Particle size distribution with SEM

Particle size distribution (PSD) is determined from scanning electron microscope (SEM) images of around 150 particles. Depending on the particle shapes, the method includes calculations on the diameters or lengths and widths of the particles. In addition to size, SEM provides qualitative information about surface morphology. SEM is a good option for irregularly shaped and non-spherical particles such as fibers, rods, and crystals that cannot be characterized meaningfully with traditional methods, including laser diffraction (LD) and dynamic light scattering (DLS). As a result of the analysis, SEM images and the determined particle size distribution for diameter (or one Feret dimension) are delivered. Samples must be completely dry for SEM. If the particles are wet or dispersed in a solvent, the sample may be dried with a suitable sample preparation method before imaging. Ask the method expert for more information and a price for analyzing your samples.
571–921 €
Read more

Particle size distribution by laser diffraction (dispersions)

ISO 13320
Determination of particle size distribution (PSD) by Laser Diffraction (LD). Analysis can be performed on dispersions or solids that can be dispersed in water or organic solvents. The method can analyze particle sizes from 0.010 µm to 2000 µm. The test report will include a particle size distribution graph, values for volumetric mean = D[4,3], and the following percent finers (percent finers represent the amount of the material from the sample that is smaller than a certain size): Dv(10) / D(v,0.1) / 10 % , Dv(25) / D(v,0.25) / 25 % , Dv(50) / D(v,0.5) / 50 % = median, Dv(75) / D(v,0.75) / 75 % , Dv(90) / D(v,0.9) / 90 %.
72–365 €
Read more

Particle size distribution by laser diffraction (solid samples)

ISO 13320
Determination of particle size distribution (PSD) by laser diffraction (LD). The analysis is performed on solid samples. The method can analyze particle sizes from ~0.4 µm to 2000 µm. The test report will include a particle size distribution graph, values for volumetric mean = D[4,3], and the following percent finers (percent finers represent the amount of the material that is smaller than a certain size): Dv(10) / D(v,0.1) / 10 %, Dv(25) / D(v,0.25) / 25 %, Dv(50) / D(v,0.5) / 50 % = median, Dv(75) / D(v,0.75) / 75 %, Dv(90) / D(v,0.9) / 90 %.
72–287 €
Read more

Particle size distribution analysis according to EC recommendations

EC Commission recommendation 2022/C 229/01
Particle size analysis with scanning electron microscopy (SEM). The analysis is performed in conformity with the 2022 European Commission recommendation on the definition of nanomaterials (2022/C 229/01). At least 300 particles are measured, the minimum Feret diameter is chosen as the dimensional parameter, and the particle size distribution histogram is reported. By default, the following data are reported: Mean, Median (d50), Number-based nano percentage according to 2022/C 229/01 definition . Please indicate if you want any other statistics reported. These projects are priced per population of similar particles. If the qualitative SEM analysis reveals multiple populations, the price needs to be adjusted according to the number of populations to be reported. This method can be used to establish the presence of small particles including nanoparticles according to EFSA novel food guidance (Particle-TR). In this case, the following statistics are also included in the report: mean and median, 10% value of the total particles, % of the particles that are smaller than 500 nm, % of the fraction of small particles that are smaller than 250 nm. For cosmetics applications, the following statistics are provided: mean and median, 10% value of the total particles, Number-based nano percentage according to 2022/C 229/01 definition . This analysis can be coupled with XRD analysis for crystallinity information, or with VSSA analysis for specific surface area information.
1,932–2,562 €
Read more

Particles size and shape analysis with image analyzer

The particle size distribution (PSD) and shapes of the particles are determined using image analysis. The method is suitable for particles sized 10 to 3,000 µm. Image analysis characterizes particle shapes, such as fibers, rods, and crystals, that cannot be analyzed meaningfully with traditional devices, such as laser diffraction or dynamic light scattering. Depending on the particle shapes, results typically include size distribution for length, width, and equivalent circular area (ECA) diameter.
278–399 €
Read more

Droplet size analysis for sprays

ISO 13320
Test of 1 bottle at 20 °C with Malvern Spraytec to characterize particle sizes between 0.1 µm and 900 µm with a standard distance between the nozzle and the laser beam. The results are reported for 3 repeat shots. Particle size distribution histograms, percent finers (Dv10, Dv50, Dv90), and % of particles smaller than 5 µm, 10 µm, and 50 µm are reported. Providing two 100% charge spray bottles per analysis is recommended for aerosols. Contact us for a quote and more information on analyses under nonstandard conditions.
490–1,128 €
Read more

Prices excluding VAT.

  • Fast turnaround times
  • Personal service from method experts
  • Competitive prices
  • Result accuracy guarantee

What is dynamic light scattering used for?

Dynamic light scattering is used to determine the size distribution of particles in solution or suspension. It can also be used in polymer characterization to determine the hydrodynamic radius of the equivalent sphere for polymer chains.

DLS is widely used for particle size distribution analysis in food and feed, cosmetics, construction materials, and pharmaceuticals, among many other industries. The technique can also be used to characterize the size of proteins, carbohydrates, and other macromolecules.

How does DLS analysis work?

The principle of DLS is based on the theory of Brownian motion, which states that particles move randomly in a liquid or gas medium. During the analysis, the sample suspension is illuminated by a laser beam, leading to the laser light scattering in all directions as it hits the suspended particles. As smaller particles diffuse faster than larger ones, the measurement of the intensity fluctuation of the scattered light can be used to calculate the particle size distribution in the solution.
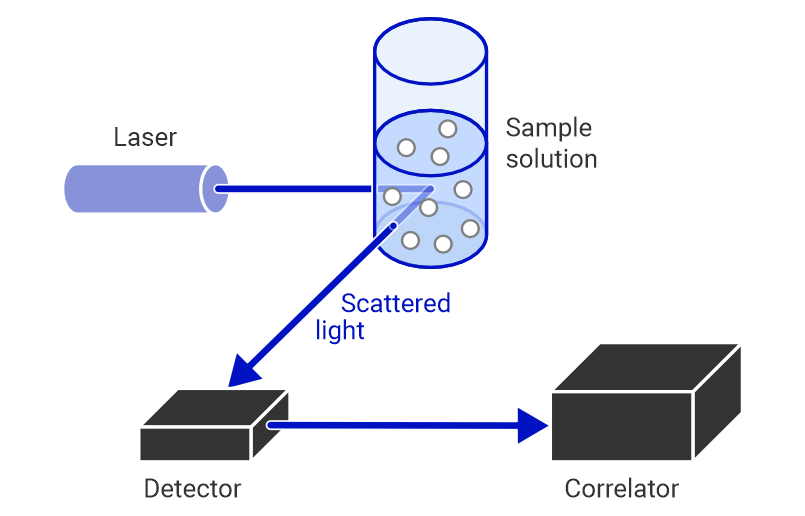
DLS diagram
A simplified diagram of the DLS setup.

Suitable samples and sample preparation

DLS analysis is performed on liquid suspensions and dispersions. The typical detectable size range is 0.3 nm to 10 µm. If larger particles are present, they may affect the reliability of the results.

Strengths and limitations of dynamic light scattering

The main strength of DLS compared with other particle size analysis methods, such as laser diffraction (LD), is the ability to analyze nanometer-scale particles. Other advantages include a relatively simple sample preparation procedure and fastness of the analysis. The main limitation of DLS is the assumption that particles are spherical, which may lead to uncertainties when determining the size of particles with very different shapes. Microscopy techniques, such as TEM or SEM, can help obtain more precise information about the shape and size of particles.

Need an analysis?

Measurlabs offers particle size distribution analyses with DLS and several other techniques, including laser diffraction, nanoparticle tracking analysis, sieve analysis, particle size and shape analysis, and electron microscopy. We process even large sample batches with speed, precision, and quality, enabling you to get the insights you need without unnecessary delays. Should you need assistance with method selection, our testing experts are always here to help craft testing plans and offer their best recommendation. Contact us through the form below to get a quote and start the discussion.

Suitable sample matrices

  • Liquids and suspensions
  • Inks and pigments
  • Microemulsions
  • Protein and polymer samples

Ideal uses of DLS analysis

  • Analyzing the hydrodynamic size and the size distribution of nanoparticles and molecules
  • Determining the size of proteins, polymers, micelles, carbohydrates and nanoparticles

Ask for an offer

Fill in the form, and we'll reply in one business day.

Answering the following questions helps us prepare an offer for you faster:

  • How many samples do you have and what is the sample material?

  • Do you have an idea about the approximate particle size range?

  • Do you know the shape of the particles (spherical, cylindrical, etc.)

  • Is the sample in solid form or is it a dispersion?

  • Do you have a recurring need for these tests? If yes, how often and for how many samples at a time?

Have questions or need help? Email us at or call our sales team.

Frequently asked questions

What is DLS analysis commonly used for?

Dynamic light scattering is used to analyze hydrodynamic particle size and size distributions in several industries and research areas, including pharmaceuticals, cosmetics, nanotechnology, and biomedical sciences.

What are the limitations of DLS?

DLS analysis assumes particles to be spherical, which makes it less suitable for other shapes, such as rods and fibers.

What kind of samples can be analyzed with DLS?

DLS samples can be liquids or solids that can be suspended in a suitable solvent.

What is Measurlabs?

Measurlabs offers a variety of laboratory analyses for product developers and quality managers. We perform some of the analyses in our own lab, but mostly we outsource them to carefully selected partner laboratories. This way we can send each sample to the lab that is best suited for the purpose, and offer high-quality analyses with more than a thousand different methods to our clients.

How does the service work?

When you contact us through our contact form or by email, one of our specialists will take ownership of your case and answer your query. You get an offer with all the necessary details about the analysis, and can send your samples to the indicated address. We will then take care of sending your samples to the correct laboratories and write a clear report on the results for you.

How do I send my samples?

Samples are usually delivered to our laboratory via courier. Contact us for further details before sending samples.